
Monday, June 18, 2018
Homemade Thermoelectric Cloud Chamber
Sunday, May 20, 2018
Homemade string and weight quadrant and azimuth finder with compass for astronomy

The quadrant is easily made at home with a printable protractor, a string and a weight. Just make sure that you remove all the numbering on the protractor before printing since you need to write the angles yourself. If you don't do this you won't be able to read the angle measured by the string with ease because they will be upside down. When the telescope is parallel to the ground the angle of 0 degrees should point directly downwards. The string should hang from the center of the circumference. If these steps are taken precisely, the instrument should display incredible accuracy.
 This azimuth marker, on the other hand, isn't quite so accurate but it's still very reliable. It was made with two separate cardboard pieces with half a circle cut into them so that the entire disk would fit through the mount. The triangular cardboard piece is used to find the azimuth angle at which the telescope points at. Admittedly, the dry compass didn't work well enough to be useful. I found way more practical to align the angles using a reference point with known azimuth angle, like the moon.
With this system I was able to find objects in the sky that are hard to find. Only using the quadrant and azimuth marker could I find faint objects like the omega centauri globular cluster, which looked like a white milky slightly pink-orange blurry spot on my telescope.

With this system I was able to find objects in the sky that are hard to find. Only using the quadrant and azimuth marker could I find faint objects like the omega centauri globular cluster, which looked like a white milky slightly pink-orange blurry spot on my telescope.
Monday, December 18, 2017
Analysis of the sound produced by a string's first and second harmonics
A common technique to produce a unique sound from a classical guitar is capable of making a string vibrate on the second harmonic. The differences between the first harmonic and second harmonic of the same string is analyzed on the spectrogram of the recorded sound bellow. The spectrogram is a frequency(y-axis) per time (x-axis) graph colored according to intensity.
 |
| Left - 1st Harmonic, Right - 2nd Harmonic |
First harmonic: 5614, 4974, 4654, 4305, 3956, 3636, 3316, 2967, 2647, 2327, 1978, 1658, 1338, 989, 669 and 320Hz.
Second harmonic: 4625, 3985, 3316, 2647, 1978, 1309 and 669Hz
The second harmonic has small streaks between it's few long streaks. These small frequency lines which end after approximately 100 milliseconds are probably stopped from vibrating after the index finger of the player is removed from the string. This movement is part of the technique to create the second harmonic sound. It also seems that the second harmonic has a higher pitch in comparison to the first harmonic.
Saturday, October 21, 2017
Estudo dos efeitos das associações entre resistores
Estudo dos efeitos das associações entre resistores
Augusto
Muniz, Rodrigo P. Oliveira, Gabriel
Gomes, Eduardo M. da Costa, Pedro Iran, Derek Moura
Colégio Bahiense, Unidade Jacarépagua, Turma M21
(19 de Outubro de 2017)
Neste estudo de resistores nós utilizamos um
amperímetro para medir a diferença de corrente elétrica entre dois circuitos
com a mesma quantidade de resistores de 1Ω. Após medir a voltagem que nossas
duas baterias que alimentavam o circuito, comprovamos que os resistores
conectados em série resultaram em uma resistência equivalente superior ao
circuito onde estavam arranjados em paralelo. Utilzando as equações ôhmicas
chegamos à 96% de aproximação ao resultado teórico.
Abstrato
Um resistor é um elementro eletrônico que introduz
resistência à o sistema. O único material no qual ao passar uma corrente não
possui resistência são os chamados supercondutores, com essa exceção, todos
componentes eletrônicos podem ser considerados resistores acidentais. Porém,
quando falando de resistores é implicado que se fala sobre componentes que
foram criados com o intuito de gerar uma resistência em específica.
O comportamento de um resistor ideal é descrito pela
Lei de Ohm, que estabelece que a corrente por um condutor entre dois pontos é
diretamente proporcional à voltagem entre os dois pontos. A proporcionalidade
entre a voltagem e corrente é determinada pela resistência do sistema. Uma
consequência da resistência em um circuito é o efeito Joule. Quando um condutor
possui uma diferença de potencial o responsável pela aceleração de elétrons é o
campo elétrico. Contudo, durante o caminho alguns elétrons são refletidos por
uma colisão com um átomo do condutor. Após a colisão, o elétron ganha
velocidade em uma direção aleatória e acaba utilizando mais da energia
potencial do campo elétrico do que seria necessário para chegar no outro lado
sem colisões. A energia do campo elétrico que foi gasta pela colisão é
transformada em energia térmica do condutor.
Materiais
Os circuitos elétricos usados para este experimento
possuem apenas resistores de 1Ω. Os dois circuitos são alimentados por duas
baterias de 1.5v em série, resultando em uma voltagem de 3v. Os componentes
foram fixados na placa de circuito pelo processo de soldagem, no qual utilizou-se
uma liga metálica de baixo ponto de fusão e um ferro de solda.

Ambos circuitos necessitam que o amperímetro esteja
conectado ao sistema para que funcionem.
Procedimento
Experimental
Ao colocar as pilhas de 1.5 volts em seus
compartimentos e conectar o amperímetro ao circuito onde os resistores estão em
paralelos detectou-se uma corrente de aproximadamente 1.9 A. Logos após,
usou-se o voltímetro para detectar a voltagem do circuito, que era por volta de
2.78 volts. Fazendo o mesmo procedimento no circuito onde os resistores estão
organizados em séria, a corrente medida foi, desta vez, de 0.64 A. A voltagem
no entanto continuou a mesma. Ambos circuitos utilizaram as mesmas pilhas.
Conclusão
Utilizando a Lei de Ohm é possível calcular a
resistência equivalente do sistema. O nosso circuito em paralelo, teoricamente,
teria uma resistência total de 0.333Ω, porém a resistência experimental
calculada foi de 1.635Ω. Enquanto isso a resistência teórica do nosso circuito
de resistores em série era de 3Ω e a resistência experimental foi de 4.343Ω. A
variação entre a resistência experimental e teórica é de 1.302Ω para o primeiro
circuito e 1.343Ω para o segundo. A semelhança entre essas variações do teórico
é uma evidência de que a suas causas são as mesmas. Essa causa seria a
resistência de todos componentes externos e internos dos dois circuitos que não
são parte dos resistores sendo analisados. Por essa razão, diminuindo-se a
média entre as duas variações entre o experimental e teórico dos resultados de
resistência do experimento teórico é possível chegar na real resistência dos
resistores experimentais.
Assumindo essa conclusão, o valor da resistência
equivalente do circuito de resistores paralelos foi medido experimentalmente
como de 0.312Ω. O circuito em série, por sua vez, possui uma resistência
experimental de 3.02Ω. Com isso, calcula-se uma precisão de 96% para as
equações da lei de ohm e de associação de resistores.
commentary 30/10/2017 : (Error bar wasn't done correctly)
commentary 30/10/2017 : (Error bar wasn't done correctly)
Referências
bibliográficas
Sunday, August 20, 2017
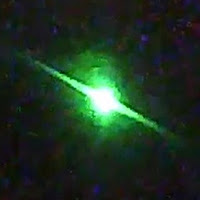
Single mirror interference fringes
A green laser beam hitting a mirror at an angle close to zero degrees formed an image on the wall in front of the mirror and behind the laser source. This image contained the reflected laser and near it the center of a interference pattern with fringes. Moving the laser closer to the mirror without changing angle of incidence had no effect whatsoever on the fringes. But when moving the angle of incidence the fringes moved away from the center when increasing the angle and towards the center when decreasing it. The interference pattern seems to be partially blocked by the laser light source and my hand. Possibly the interference was caused by a reflective component inside of the laser that bounced the light back a second time on itself.

Lloyd's Mirror attempt
In this attempt to reproduce the Lloyd's Mirror experiment done in 1834 a red laser was used. The laser beam at a small angle hit the face of a mirror that was parallel to the ground and perpendicular to the wall where the image was formed. The image consists of a bright column in the center formed by triangle-like spots stacked one after the other. Around the central column small dark lines parallel to each other can be seen crossing the red interference background.


Saturday, July 22, 2017
The interference patterns of light when passing through different types of slits
In this experiment I shined laser light of 532nm of wavelength on different types of carefully made aluminium foil cutouts. The images were captured using a webcam in front of the wall the laser was pointed at. Eye protection is advised due to the reflective nature of the foil. On the right you have sketches representing the aluminium foil where black represents the aluminium, white represents gaps of air and the green dot represents the position where the laser was shined at. Next to those you have the pictures taken by the webcam of the respective diffraction pattern.


1. Single Slit


A single line formed by wide strikes with a bright flat center
2. Double Slit


A single line formed by short strikes with a bright flat center.
3. Half Slit


A single line with a bright round center.
4. Cross Slit


Two parallel lines formed by wide strikes with a bright cross center.
5. V-Slit


Similar to Cross Slit pattern except for angle between lines.
Subscribe to:
Posts (Atom)